Total Strand Count
The total strand count represents the number of individual hair strands detected in the analyzed image area. This is the primary metric for measuring hair density.
Example: A result of 150 strands means our AI detected 150 individual hairs in the scanned area.
Hair Grouping Breakdown
Hair naturally grows in groups (follicular units). Our AI categorizes hairs into 7 groups based on how many strands emerge from the same follicular unit:
Group 1
Single hair follicular units
Group 2
Two-hair follicular units
Groups 3-7
Multi-hair follicular units
💡 Clinical Significance: Higher numbers in groups 2-4 typically indicate healthier, denser hair growth patterns.
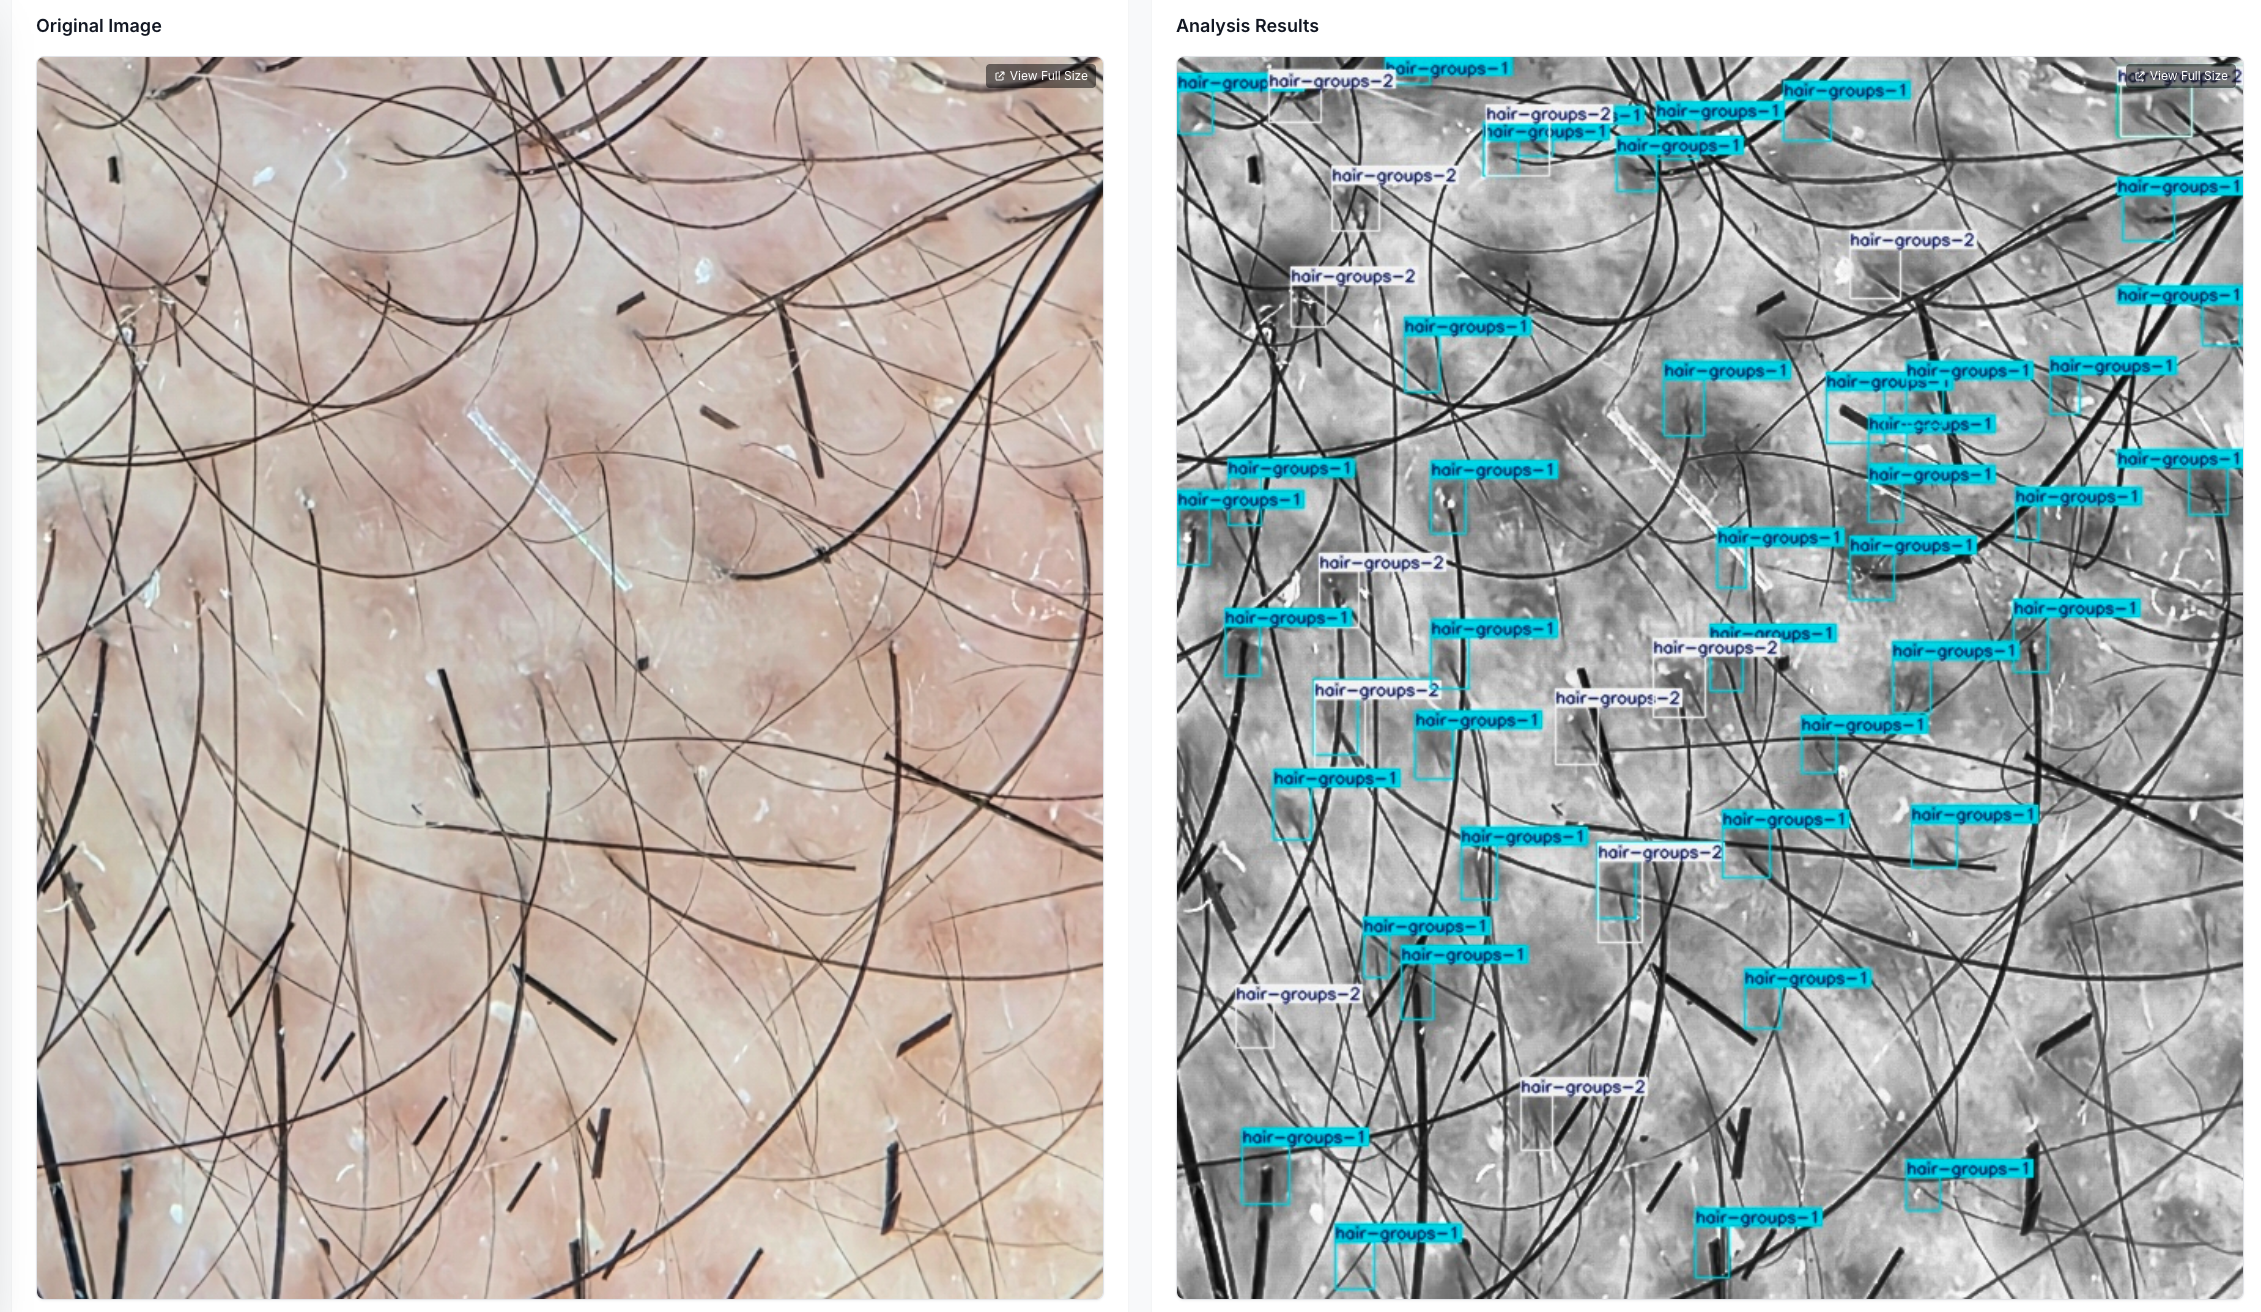
Annotated Image
The annotated image shows bounding boxes around each detected hair group with labels indicating:
- Group number (1-7 hairs per unit)
- Confidence score (0-1, higher is more certain)
Density Analysis Results
When using density analysis, you receive all hair counting metrics plus detailed density measurements:
Hairs per cm²
Average hair density across sampled regions
Per-Region Analysis
Individual density measurements for each sampled area
💡 Note: Density analysis requires a px_per_mm calibration value. Set this once and it's saved to your account.
Baldness Analysis (Norwood Scale)
Baldness analysis classifies hair loss severity using the Norwood scale (stages I-VII):
Stage I-II
Minimal to slight recession
Stage III-IV
Moderate recession and thinning
Stage V-VII
Significant to extensive hair loss
Before/After Comparison
Before/after comparisons analyze two images and provide:
- Individual analysis of both before and after images
- Annotated images for both photos
- Comparison summary with change metrics
💡 Best results: Use the same lighting, angle, and distance for both images. Costs 2 credits per comparison.
Tracking Progress Over Time
For treatment efficacy or transplant success monitoring: